How Do I Track KPIs Across Multiple Business Locations in Real Time?
The ability to track KPIs across multiple locations is no longer a luxury reserved for large enterprises with dedicated analytics teams. AI is fundamentally changing how multi-site operators stay across their numbers — pulling live data from every location into a single view, flagging anomalies before they become crises, and surfacing the insights that actually drive decisions. If you're still compiling spreadsheets from three different systems at the end of each week, you're not just wasting time — you're making decisions on stale information.
Here's what's genuinely changing, and how to use it.
Why Tracking KPIs Across Multiple Locations Is Now an AI Problem
Running two, five or fifteen locations means your performance data is scattered across your POS, your accounting software, your rostering platform, and possibly a CRM. Most operators patch this together manually — a manager exports a report, someone aggregates it into a shared sheet, and by the time it lands in your inbox the week has already moved on.
AI-driven business intelligence platforms change this by doing three things simultaneously: unifying your data sources in real time, learning what "normal" looks like for each location, and alerting you only when something meaningfully deviates. That last point is underrated. The goal isn't more data — it's the right signal at the right time.
Outcome 1: Free Up Staff Time with Automated Reporting
The single biggest drain on management time in multi-site operations isn't making decisions — it's assembling the information needed to make them. Area managers, finance staff and site managers spend significant hours each week just producing reports.
Automated weekly reporting eliminates this. When your KPI dashboard pulls live from your POS (Square, Lightspeed, Kounta), your accounting software (Xero, MYOB, QuickBooks) and your rostering tools (Deputy, Tanda, Employment Hero), the numbers reconcile themselves. Staff don't need to touch a spreadsheet. Managers get a clear picture of revenue, labour costs, margins and foot traffic for each site — every morning, without lifting a finger.
This matters especially as [labour costs rise and Award compliance becomes more complex](https://www.fairwork.gov.au). When your rostering data feeds directly into your KPI dashboard, you can see actual versus budgeted labour costs per location in real time — not after payroll has already run.
Outcome 2: Catch Problems Early Across Every Site
The risk in multi-site operations is that a problem at one location quietly grows before anyone notices. A margin leak at your busiest site. A spike in no-shows at your newest one. A cash-flow shortfall building over a fortnight.
A well-configured multi-site dashboard with AI-driven early warning gives you:
- Margin alerts when cost of goods sold drifts outside your set threshold at any location
- Cash-flow forecasting that flags if a site is trending toward a shortfall in the coming weeks
- Labour compliance flags when rostered hours are likely to breach overtime thresholds
- Customer churn signals when repeat visit frequency drops at a particular location
- Anomaly detection on daily takings — if one site's revenue is unexpectedly low on a typically strong trading day, you know about it by mid-morning
The [Australian Small Business and Family Enterprise Ombudsman](https://www.asbfeo.gov.au) consistently notes that cash-flow management is among the most common pressure points for growing SMEs. Real-time visibility across locations is one of the most direct ways to address it.
Outcome 3: Capitalise on What's Already Working
Tracking KPIs isn't only about finding problems — it's about understanding which locations, staff members, product lines and customer segments are outperforming, and then replicating that success deliberately.
A real-time multi-location dashboard lets you:
- Identify your highest-margin location and benchmark others against it
- See which site's team has the strongest upsell rate and share their approach
- Spot which customer segments drive the most lifetime value — and target similar profiles at underperforming sites
- Compare promotional campaign performance across locations using CRM data from HubSpot, Mailchimp or ActiveCampaign
- Use demand forecasting to pre-position stock or staff at locations that typically spike on certain days
This is where benchmarking against industry data adds real value. Understanding how your locations compare against [ABS](https://www.abs.gov.au) and ANZSIC industry averages gives you an external reference point — not just an internal one.
How Corvana Applies AI to Multi-Site KPI Tracking
Corvana is built specifically for Australian SMEs running multiple locations. It connects your existing tools — POS systems like Square, Lightspeed and Kounta; accounting platforms including Xero, MYOB and QuickBooks; rostering and payroll via Deputy, Tanda and Employment Hero; and CRM tools like HubSpot and Salesforce — into a single real-time dashboard without requiring you to change how you operate.
From there, Corvana's AI does the heavy lifting:
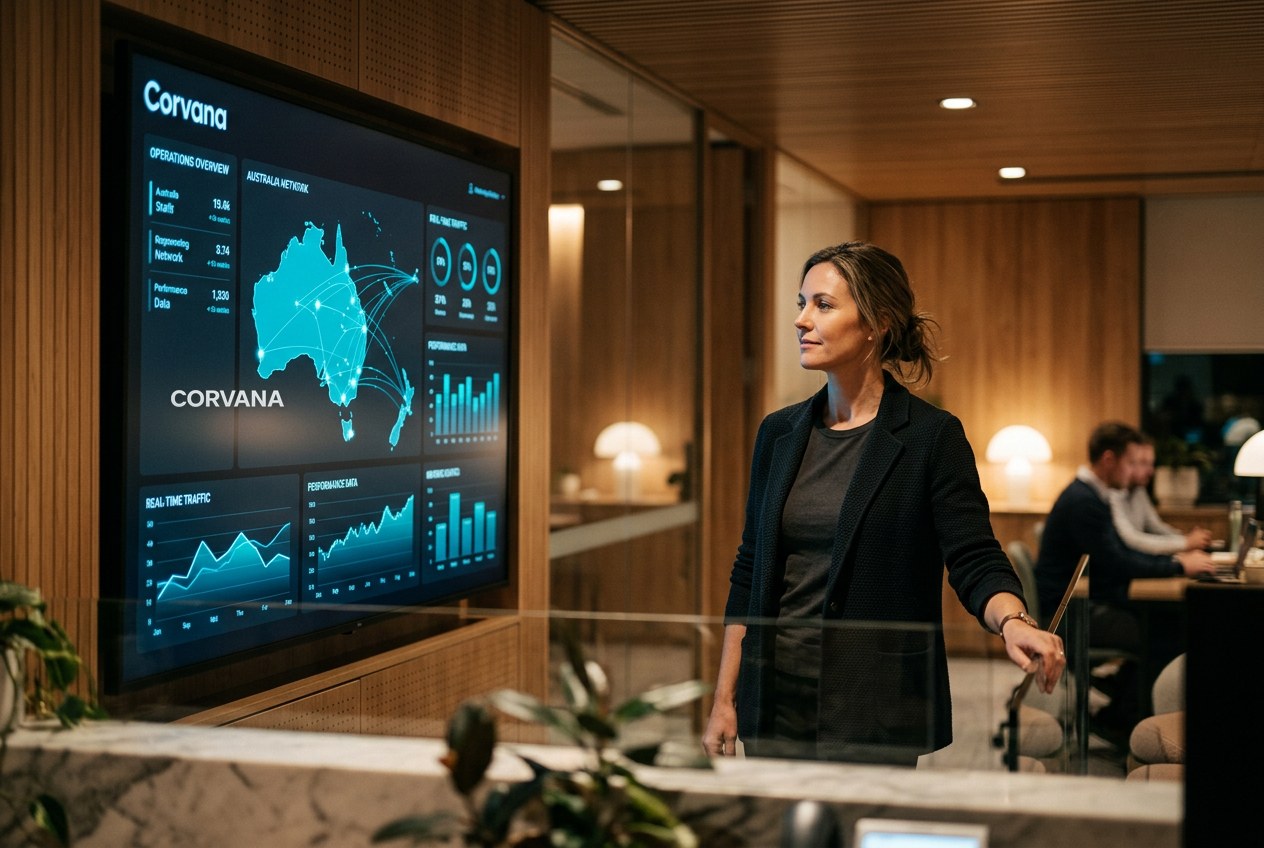
- Live dashboards show revenue, margin, labour cost and customer metrics for each location, with the ability to drill down or roll up across the group
- Automated weekly reports are generated and distributed without manual input
- AI-driven cash-flow and demand forecasting gives each site a forward view, not just a rear-view mirror
- Customer lifetime value and churn early-warning flags which customer segments at which locations need attention
- Benchmarking positions each location against ATO and ANZSIC industry data so you know where you genuinely stand
- Role-based permissions mean your site managers see their location's data, area managers see their region, and you see everything
No data science degree required. No new software for your team to learn. Just the picture you need, when you need it.
---
Frequently Asked Questions
Do I need a technical team to set up real-time KPI tracking across multiple locations?
No. Modern AI business intelligence platforms are designed to connect to the tools you already use — your POS, accounting software and rostering system — without requiring custom development or a data analyst. Setup typically involves connecting your existing accounts via integrations, after which the platform handles data unification automatically.
How is a multi-site dashboard different from just running reports in my accounting software?
Accounting software shows you financial history for a single entity or combined view — it doesn't give you real-time, location-by-location performance across operations, labour, customers and sales simultaneously. A purpose-built multi-site dashboard unifies all of those data sources in real time and applies AI to surface what actually needs your attention, rather than leaving you to find it yourself.
Can I control what each manager sees on the dashboard?
Yes. Role-based permissions allow you to configure exactly what each user can view — a site manager might see only their location's data, while an area manager sees their cluster and a business owner sees the full group. This protects commercially sensitive information while giving each person the operational visibility they need.
---
If you'd like to see how Corvana brings all of this together for your locations, we'd be glad to show you.