AI Is Reshaping How Australian Businesses Operate
Understanding how to improve operational efficiency using data is no longer a question reserved for enterprise boardrooms — it is the daily reality facing small and medium business operators right across Australia. AI is accelerating this shift in a meaningful way: where operators once relied on gut feel, end-of-month reports and spreadsheets stitched together overnight, they can now access a live, connected picture of their business and act on it in real time.
The [Productivity Commission](https://www.pc.gov.au) has consistently highlighted that productivity gains for Australian businesses are closely tied to the uptake of digital tools and data-driven decision-making. For operators managing staff, suppliers, customers and cash flow simultaneously, that is not an abstract observation — it is a genuine opportunity to get ahead.
How to Improve Operational Efficiency Using Data
The direct answer: To improve operational efficiency using data, connect your core business systems — POS, accounting, rostering and CRM — into a single platform that surfaces patterns, flags problems early and highlights what is already working. AI-driven analysis then turns that unified data into clear actions: where to reduce waste, which staff or products are driving results, and where cash-flow risk is building before it becomes a crisis.
The sections below unpack exactly how this works in practice across three outcomes that matter most to operators.
---
Outcome 1: Free Up Staff Time by Automating the Reporting Grind
One of the most immediate gains from a data-driven approach is recovering the hours your team spends pulling reports together manually. When your accounting platform (such as Xero, MYOB or QuickBooks), your POS (Square, Lightspeed or Shopify) and your rostering tool (Deputy, Tanda or Employment Hero) are operating in silos, someone is always bridging the gap — exporting, copying, reconciling.
Automated reporting changes this entirely. When data flows between systems and AI surfaces only what needs attention, your managers shift from building reports to acting on them. A weekly summary that used to take two hours lands in an inbox automatically, with anomalies already flagged.
This matters beyond convenience. Time spent on manual reconciliation is time not spent on customers, training or growth. For operators with lean teams, that trade-off is significant.
---
Outcome 2: Reduce Business Weaknesses by Catching Problems Early
Data's most underrated value is what it prevents. Margin leaks, rising staff costs, slow-moving inventory, compliance gaps and early signs of customer churn rarely announce themselves — they accumulate quietly until they become expensive problems.
A connected data platform changes the dynamic by monitoring for early warning signals continuously, including:
- Labour cost drift — when rostered hours edge past your target as a percentage of revenue, before it shows up in your month-end P&L
- Cash-flow risk — AI forecasting that models your upcoming obligations against projected inflows so you are not surprised by a tight fortnight
- Compliance gaps — award rate monitoring that flags potential underpayment risk in line with [Fair Work Ombudsman](https://www.fairwork.gov.au) obligations, before they become a formal issue
- Customer churn signals — declining visit frequency or purchase value from segments that were previously reliable
- Inventory and margin anomalies — products selling well but contributing poorly to profit
Early warning is not about alarm fatigue — it is about giving operators a genuine chance to respond rather than react.
---
Outcome 3: Capitalise on Your Strengths — People, Products and Segments
Efficiency is not only about cutting waste. It is equally about doubling down on what is already working: the staff members who consistently outperform, the products with the strongest margins, the customer segments with the highest lifetime value, and the locations or time periods that punch above their weight.
Data makes these patterns visible rather than anecdotal. When you can see — with confidence — that a particular product category drives disproportionate margin, or that a specific customer cohort returns at twice the average rate, you can allocate resources, marketing spend and staff attention accordingly.
The [Australian Bureau of Statistics](https://www.abs.gov.au) tracks business activity across sectors, and the consistent pattern is that businesses investing in understanding their own performance data are better positioned to adapt through economic cycles. Knowing your strengths is a genuine competitive advantage.
---
How Corvana Applies AI to This
Corvana is built specifically for this challenge. It connects your existing tools — whether that is Xero or MYOB for accounting, Square or Lightspeed for point of sale, Deputy or Employment Hero for rostering, or HubSpot and Mailchimp for customer engagement — into one real-time intelligence layer without requiring you to replace any of them.
From that unified data, Corvana's AI delivers:
- Live dashboards showing revenue, labour, margin and cash position at a glance
- AI-driven forecasting for cash flow, demand and staffing needs across your busiest periods
- Automated weekly reporting that arrives in your inbox — no manual compilation required
- Benchmarking against ATO and ANZSIC industry data so you know how your business performs relative to comparable operations
- Customer lifetime value and churn early-warning that helps you identify and retain your most valuable segments
- Compliance monitoring that keeps award rate obligations front of mind
- Industry-specific roles and permissions so staff see only what is relevant to their function
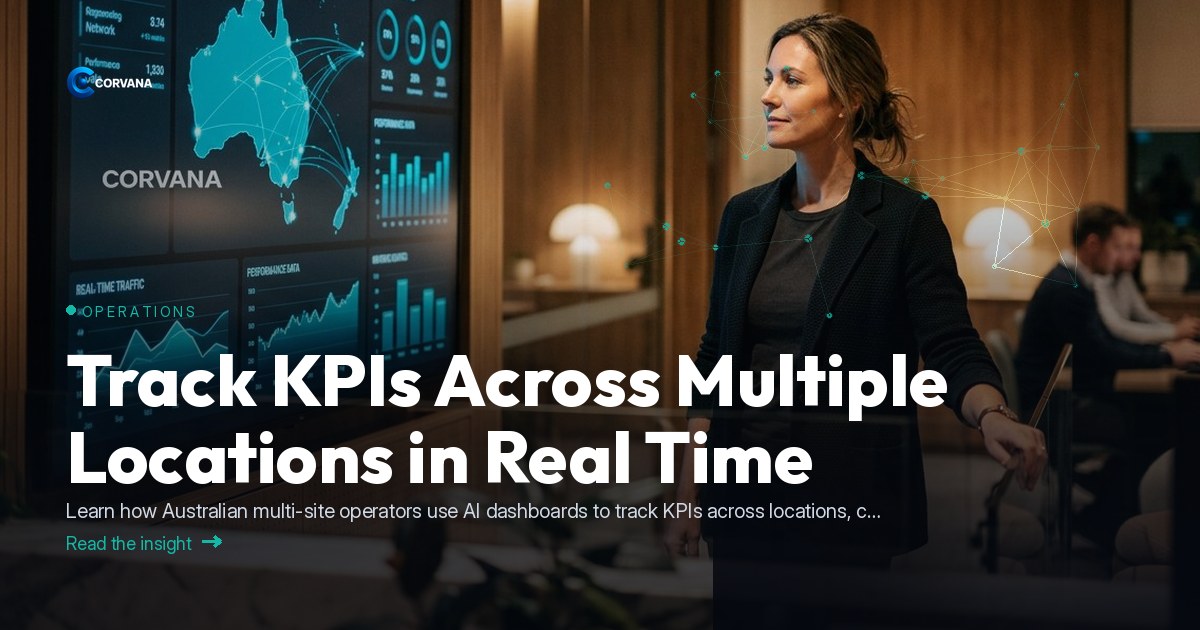
For multi-location operators, Corvana provides location-level comparisons alongside the consolidated view — making it straightforward to identify which sites are leading and which need support.
---
Frequently Asked Questions
Do I need to replace my existing software to use a business intelligence platform?
No — and this is a common concern worth addressing directly. Platforms like Corvana are designed to sit above your existing tools, connecting them rather than replacing them. Your team keeps using the POS, accounting and rostering software they already know; the BI layer simply unifies the data and surfaces insights across all of it.
How quickly can data-driven changes improve operational efficiency?
Many operators notice early wins within the first few weeks — particularly around labour cost visibility and automated reporting — because those gains come from connecting systems that were already generating data but not talking to each other. Deeper improvements, like identifying customer churn patterns or benchmarking margin performance, typically become clearer over one to three months as the platform builds a meaningful baseline.
Is this approach practical for a small business, or is it only suited to larger operations?
It is genuinely practical for small businesses. In fact, operators with smaller teams often see the largest relative benefit because they have the least capacity to absorb the time cost of manual reporting. AI handles the analysis that would otherwise require a dedicated analyst, which means a business owner or single manager can stay across the numbers without it consuming their week.
---
If you would like to see how Corvana brings all of this together for your specific operation, it is worth taking a closer look at what the platform can do.