
Why AI Is Changing How Australian Retailers Manage Labour Costs
For years, monitoring your wage to sales ratio retail Australia-wide has meant pulling numbers from your POS, cross-referencing your payroll run, and hoping the spreadsheet you built six months ago still makes sense. AI is ending that cycle. Modern business-intelligence platforms now connect your rostering, sales and accounting data in real time — so instead of discovering a labour blowout at month-end, you see it the moment a shift runs long or foot traffic drops below forecast.
That shift matters enormously in retail, where labour is typically the largest controllable cost after cost of goods. Getting the ratio right is not about squeezing staff — it is about deploying the right people at the right times, protecting margin, and freeing your team to focus on the floor rather than the spreadsheet.
---
What Is the Wage-to-Sales Ratio and Why Does It Matter?
The wage-to-sales ratio (sometimes called the labour cost percentage) is simply total staff costs divided by total revenue for a given period, expressed as a percentage.
Formula: `Total Wage Cost ÷ Total Sales Revenue × 100`
For example, if your store turns over $80,000 in a month and your total wage bill — including superannuation and any on-costs — is $20,000, your wage-to-sales ratio is 25%.
What Are Typical Benchmarks for Australian Retail?
Benchmarks vary considerably by retail sub-category, store format and whether you carry a franchise overhead, but as a general guide:
- Specialty retail (apparel, homewares, gifts): Ratios commonly range from 18% to 28%
- Grocery and convenience: Tends to sit lower, often between 12% and 20%, due to high transaction volume
- Hardware and trade supplies: Often 15%–22%, driven by a mix of trade counter staff and floor consultants
- Luxury or high-touch retail: Can comfortably sit at 25%–35% where service is a deliberate margin driver
- Online-first or click-and-collect heavy operations: Typically run leaner, though fulfilment labour is sometimes undercooked in the calculation
These are directional ranges, not hard rules. The [Australian Bureau of Statistics](https://www.abs.gov.au) publishes industry-level data through its Business Indicators and Retail Trade surveys that can help you contextualise your own category. The [ATO's small business benchmarks](https://www.ato.gov.au) also provide wage-cost-to-turnover guidance by ANZSIC code, which is worth reviewing annually.
The more useful question is not "what is the industry average?" but "what ratio is sustainable *for my store*, given my sales mix, trading hours and service model?"
---
Outcome 1 — Optimising Staff Time Through Smarter Scheduling
Every retailer knows the pain of being over-staffed on a quiet Tuesday and scrambling on an unexpectedly busy Saturday. AI-driven demand forecasting changes this by analysing historical sales patterns, local events, weather trends and promotional calendars to predict when you actually need people on the floor.
When your rostering tool is connected to your sales data, managers stop guessing. Shifts are built around projected revenue, not habit. The practical result is fewer unproductive labour hours and a wage-to-sales ratio that reflects deliberate decisions rather than scheduling inertia.
This also has a compliance dimension. [Fair Work Ombudsman](https://www.fairwork.gov.au) obligations around minimum engagement periods, overtime and penalty rates mean that every unnecessary hour carries a disproportionate cost — and a risk if award conditions are misapplied.
---
Outcome 2 — Reducing Weaknesses by Catching Problems Early
A creeping wage-to-sales ratio is one of retail's most common early-warning signals — and one of the most overlooked until it is too late to course-correct in the current month.
Common culprits include:
- Shift lengths that drift beyond what was rostered
- Unplanned additional staff hours during quiet periods
- Superannuation and on-costs excluded from the labour calculation
- Seasonal sales dips that aren't matched by roster reductions
- High turnover driving induction and training costs that don't appear in the wage line
AI-powered monitoring flags these anomalies in real time, not at month-end. If your ratio jumps above your set threshold mid-week, you know about it while there is still time to adjust — not when your accountant sends the P&L.
---
Outcome 3 — Capitalising on Your Strengths
Not all shifts, staff members or store locations are equal. A well-connected BI platform reveals which team members drive the highest average transaction value, which days your best-converting traffic arrives, and which product categories justify a higher service investment.
This intelligence lets you schedule your most effective staff during peak revenue windows, align your promotional activity with your highest-margin lines, and make the case — with data — for expanding hours in locations that are genuinely outperforming.
---
How Corvana Applies AI to Retail Labour Benchmarking
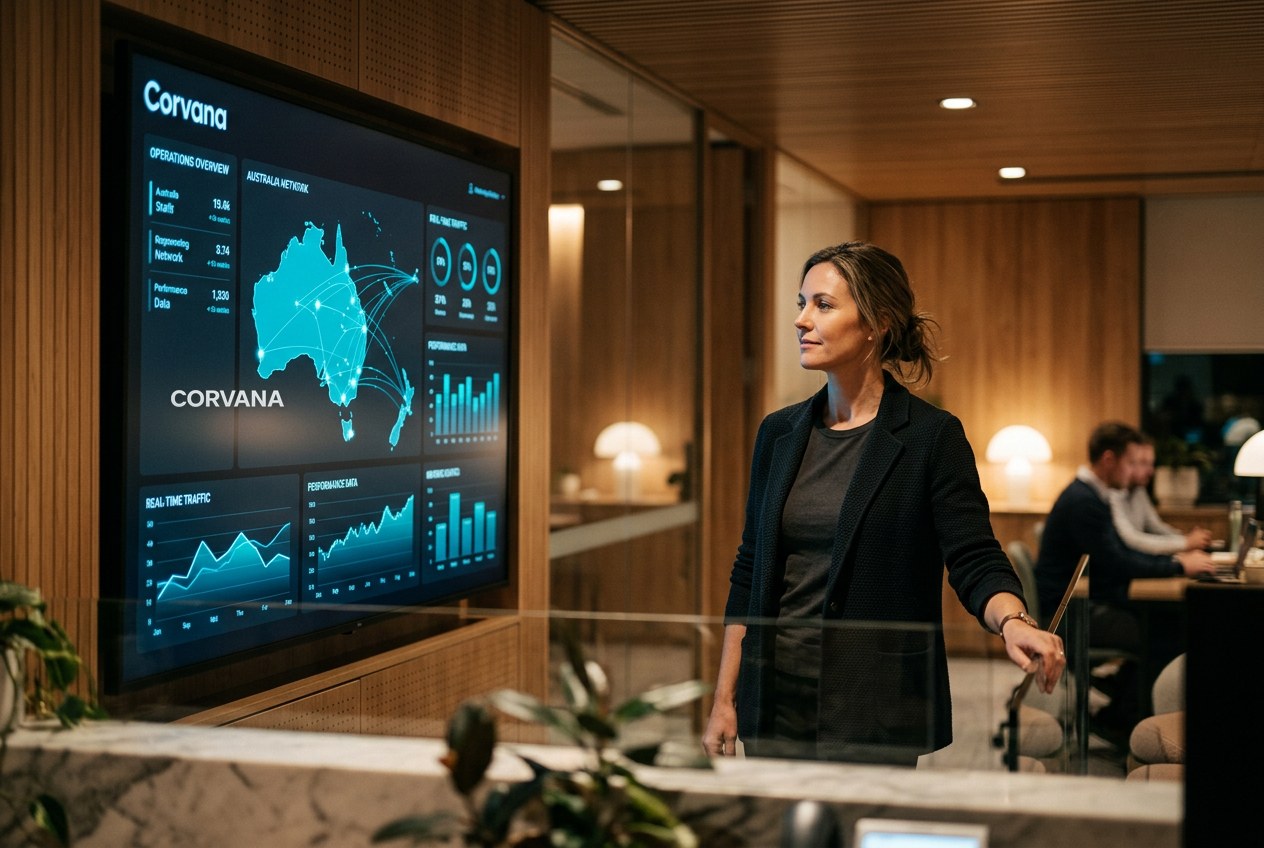
Corvana unifies your retail data stack into one live picture. For Australian store operators, the most relevant connections include:
- POS: Square, Lightspeed, Shopify, Kounta — sales, transaction volume and basket size flow in automatically
- Rostering and payroll: Deputy, Tanda, Employment Hero — scheduled and actual hours reconciled against sales in real time
- Accounting: Xero, MYOB, QuickBooks — on-costs, superannuation and payroll tax included so your labour percentage is complete, not just base wages
Corvana's AI then benchmarks your wage-to-sales ratio against ATO/ANZSIC industry data for your retail category, sends automated weekly summaries to owners and managers, and surfaces alerts when your ratio trends outside your set parameters. No manual reporting. No month-end surprises.
For multi-location retailers, location-level benchmarking shows which stores are running lean, which are carrying excess labour, and where scheduling changes would have the greatest impact on overall profitability.
---
Frequently Asked Questions
What is a good wage-to-sales ratio for a retail store in Australia?
There is no single correct answer — it depends on your retail category, service model and cost structure. Specialty retailers often target somewhere between 20% and 26%, while higher-volume, lower-touch formats may aim for 15% or below. The most useful benchmark is your own historical performance compared against ATO industry data for your ANZSIC code, reviewed quarterly.
Should superannuation and on-costs be included in my wage-to-sales ratio calculation?
Yes, always. Base wages alone understate your true labour cost by a meaningful margin once you include superannuation (currently 11.5% of ordinary time earnings), payroll tax (where applicable), and WorkCover premiums. If you exclude these, your ratio will look healthier than it is, and your staffing decisions will be based on incomplete information.
How often should I review my retail labour benchmark?
At minimum, monthly — but weekly visibility is more useful for active management. Labour costs can shift quickly with roster changes, trading pattern shifts or award rate increases, and a month is too long a lag if things are moving in the wrong direction.
---
If you'd like to see how Corvana brings your POS, payroll and accounting data together to keep your wage-to-sales ratio where it should be, we'd be happy to walk you through it.