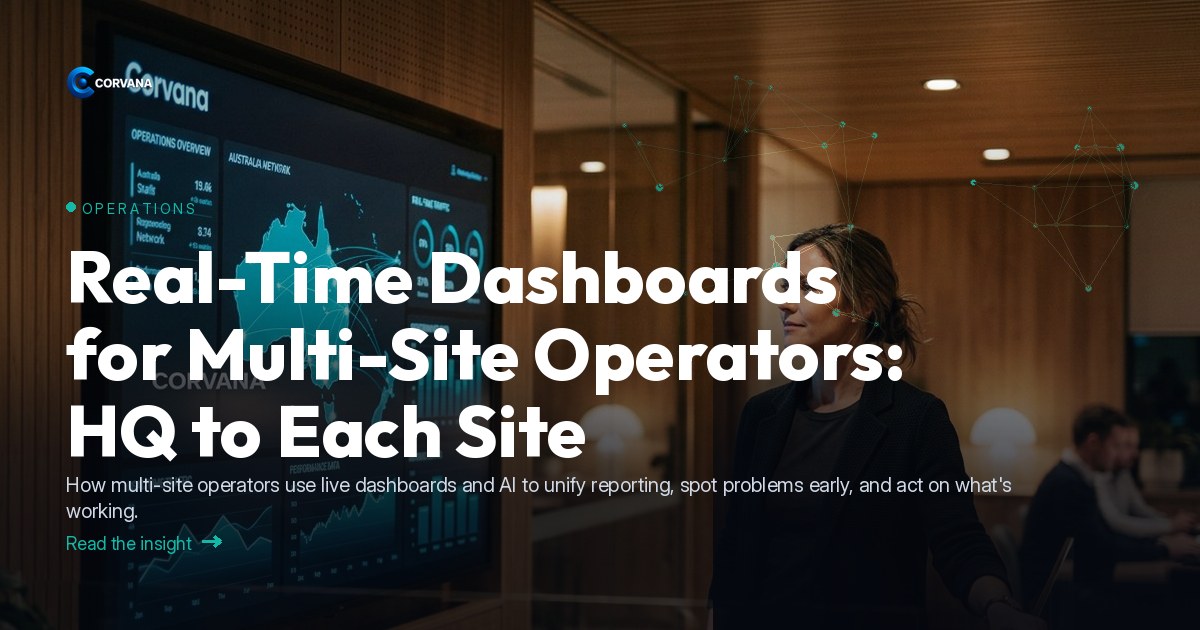
Real-Time Dashboards for Multi-Site Operators: From Head Office to Each Site
AI is reshaping how multi-site businesses are run — and real-time dashboards are where that shift becomes visible and actionable. For operators managing two sites or twenty, the old approach of waiting for end-of-week spreadsheets or chasing managers for updates is giving way to something fundamentally different: a live, unified picture of every location, updated continuously, with AI surfacing the signals that actually need your attention.
This isn't about having more data. It's about having the *right* data at the right moment — so head office can act fast, site managers can focus on their teams, and the whole operation moves in the same direction.
What Real-Time Dashboards Actually Change for Multi-Site Operations
Traditional multi-location reporting is fragmented by design. Each site runs its own POS, its own rostering system, its own accounting — and pulling those threads together falls to someone at head office who spends hours reconciling figures that are already days old by the time they're reviewed.
[McKinsey & Company](https://www.mckinsey.com) research consistently shows that organisations making decisions from unified, timely data outperform those relying on lagged or siloed reporting. For multi-site operators, this gap is especially costly: a problem brewing at one location — a margin leak, a staffing shortfall, a customer satisfaction dip — can quietly compound for weeks before it surfaces in a monthly report.
Real-time dashboards eliminate that lag. When data from your POS, accounting platform, rostering system and CRM flows into a single live view, the question shifts from "what happened last month?" to "what's happening right now, and what do I do about it?"
Outcome 1: Freeing Up Staff Time Across the Network
The administrative burden of multi-site reporting falls disproportionately on two groups: operations managers at head office who consolidate figures, and site managers who field requests for data they don't always have easy access to.
AI-powered dashboards change this by automating the work that previously required manual effort:
- Automated weekly reporting delivered to the right people without anyone compiling a spreadsheet
- Role-based views so each site manager sees their own location's data, and head office sees everything
- Alerts triggered by real events — a site's labour cost crossing a threshold, a revenue figure falling below forecast — rather than waiting for a scheduled review
When site managers aren't spending Friday afternoons pulling figures together, they're on the floor. When operations managers aren't reconciling data across systems, they're making decisions. That reallocation of time compounds across a network.
Outcome 2: Catching Problems Early Across Every Location
The risk profile of a multi-site business is inherently more complex than a single location. A margin issue, a compliance gap or an emerging staff retention problem at one site can be invisible to head office until it becomes a much larger problem.
Live multi-site reporting gives head office genuine early-warning capability:
- Margin monitoring by location — if one site's cost of goods is drifting upward relative to others, that's visible immediately rather than at month-end
- Cash-flow risk signals — AI forecasting can flag when a site's revenue trajectory suggests a shortfall before it arrives
- Compliance monitoring — rostering and payroll data can be monitored across sites to surface anomalies before they become Fair Work or [Safe Work Australia](https://www.safeworkaustralia.gov.au) issues
- Customer churn early-warning — if one location's repeat visit rate is declining, that's a signal worth investigating before it shows up in revenue
The [Productivity Commission](https://www.pc.gov.au) has highlighted the role of data and digital tools in lifting productivity and reducing operational risk for Australian businesses. For multi-site operators, the ability to benchmark one site against another — or against industry norms — is one of the most practical expressions of that principle.
Outcome 3: Capitalising on What's Already Working
Multi-site reporting isn't only about finding problems. A live dashboard view across your network also surfaces your strengths — the location, the team, the product mix or the customer segment that's genuinely outperforming — so you can understand why and replicate it.
Practically, this means:
- Identifying which site has the strongest revenue-per-labour-hour and understanding what's driving it
- Seeing which customer segments are returning most consistently across locations
- Recognising which managers are running lean, high-performing rosters — and using that as a benchmark for others
- Spotting demand patterns that allow smarter staffing and inventory decisions across the whole network
This kind of cross-location benchmarking is difficult to do manually. With AI surfacing the patterns, it becomes a routine part of how head office operates.
How Corvana Applies AI to This
Corvana is built for exactly this operating model. It unifies data from the platforms multi-site operators already use — POS systems including Square, Lightspeed and Kounta; accounting via Xero, MYOB or QuickBooks; rostering and payroll through Deputy, Tanda or Employment Hero; and CRM tools like HubSpot, Salesforce or ActiveCampaign — into a single real-time picture across every location.
From that unified data, Corvana's AI delivers:
- Live multi-site dashboards with drill-down from network level to individual site
- Industry-specific staff roles and permissions so site managers, operations managers and executives each see the view relevant to their role
- AI-driven forecasting for cash flow, demand and staffing, generated per location and across the network
- Automated weekly reporting that goes to the right people without manual compilation
- Benchmarking against ATO and ANZSIC industry data so you know not just how your sites compare to each other, but how they compare to the broader market
- Customer lifetime value tracking and churn early-warning across your customer base
For multi-site operators, the practical effect is that head office has genuine visibility without micromanaging, site managers have the data they need without administrative burden, and the whole network is pulling from the same source of truth.
[Gartner](https://www.gartner.com) consistently identifies unified data platforms and AI-assisted decision-making as among the highest-value technology investments for operations-focused organisations — a finding that translates directly to the multi-location context.
Frequently Asked Questions
Can a real-time dashboard really pull together data from multiple different systems across our sites?
Yes — modern AI business-intelligence platforms are built to connect with the POS, accounting, rostering and CRM tools each site already uses, even if those systems differ between locations. The platform normalises the data so head office gets a consistent, comparable view across every site. Setup typically involves connecting your existing tools rather than replacing them.
How is multi-site reporting different from just having each site send through a weekly summary?
Weekly summaries are delayed, inconsistent in format, and only as accurate as the person compiling them. Multi-site reporting via a live dashboard pulls data directly from source systems in real time, applies consistent logic across every location, and surfaces anomalies automatically — rather than relying on someone to notice and report them. The difference is most obvious when something goes wrong: you know immediately, not a week later.
What level of access should site managers have versus head office?
Best practice is role-based access: site managers see their own location's data in full detail, operations managers see a curated view across a region or the whole network, and executives see high-level performance summaries with the ability to drill down. This keeps reporting relevant at every level without overwhelming site managers with network-wide data that isn't actionable for them.
---
If you'd like to see how Corvana brings all of this together for your network, we'd be glad to show you what it looks like in practice.