Franchise Business Intelligence: Benchmarking Every Site in One View
Franchise business intelligence has moved from a nice-to-have into a genuine operational edge — and the shift is being driven by AI. Where multi-location operators once relied on weekly spreadsheets, end-of-month reports and gut feel, AI now surfaces live performance signals across every site, flags problems before they compound, and points directly to the locations and products that are already leading the pack.
For franchise groups and multi-location businesses — from quick service restaurants (QSR) to fitness studios, healthcare practices and retail chains — this changes what good operations management actually looks like.
Why Franchise Business Intelligence Is Changing Operations Right Now
The old model of multi-location reporting had a built-in lag. By the time a franchisee submitted their numbers, a finance team consolidated them, and a report landed in the franchisee's inbox, the data was already history. Decisions were made on stale information.
AI changes the loop. Modern platforms ingest data from POS, payroll, accounting and CRM systems in real time, run pattern recognition across every site simultaneously, and translate raw numbers into actionable signals — automatically. [McKinsey & Company](https://www.mckinsey.com) research consistently shows that organisations using AI to automate data workflows and surface decision-relevant insights operate faster and with meaningfully lower administrative overhead than those relying on manual reporting cycles.
For Australian franchise operators navigating rising labour costs, shifting consumer behaviour and tightening margins, that speed-to-insight gap is now a competitive liability if left unaddressed.
Outcome 1: Freeing Up Staff Time With Automated Reporting
Manual reporting in a multi-site operation is a tax on everyone. Area managers reconcile spreadsheets. Franchisees copy figures between systems. Head office chases submissions. None of this creates value.
AI-driven business intelligence replaces that cycle with automated, scheduled reporting that pulls live data from every integrated system and distributes it without anyone lifting a finger. Franchisors get a consolidated group view. Franchisees see their own unit dashboard. Area managers see ranked comparisons across their portfolio — all in one place, updated continuously.
This matters practically because it redirects skilled people from report-building to decision-making. An area manager who previously spent half a day compiling weekly performance packs can instead spend that time coaching the sites that need it.
Outcome 2: Reducing Weaknesses — Catching Problems Before They Spread
In a franchise network, a problem at one site can quietly become a systemic issue. A labour cost blowout that goes unnoticed for six weeks. A margin leak on a high-volume product category. A cash flow gap building up ahead of a rent cycle.
Unit-level benchmarking powered by AI identifies these patterns as they emerge — not after they've done damage. Anomaly detection compares each site against its own historical trend and against network averages, flagging outliers automatically. Operators don't need to know what to look for; the platform tells them where to look.
For QSR groups in particular, this kind of early-warning capability is critical. Food costs, labour ratios and transaction throughput move fast. A site drifting out of range on any of these metrics needs attention within days, not at the next monthly review.
The [Productivity Commission](https://www.pc.gov.au) has noted that Australian businesses that adopt structured performance monitoring and data-informed management tend to achieve sustainably better productivity outcomes — a finding that maps directly onto what unit-level benchmarking enables across a franchise network.
Outcome 3: Capitalising on Strengths — Finding What's Already Working
Benchmarking isn't only about finding what's broken. Its most underused application in multi-location businesses is identifying what's working exceptionally well and replicating it.
When you can see every site ranked by margin, revenue per labour hour, customer retention rate or average transaction value, patterns emerge. A particular site manager consistently delivers above-network results. A product mix that performs strongly in one region could be tested in another. A rostering structure that keeps labour costs in check without affecting service quality.
Multi-location analytics makes these insights visible and transferable. Instead of relying on informal knowledge sharing or anecdotal best practice, operators get a structured, data-backed picture of their highest performers — and a replicable playbook to lift the rest of the network.
How Corvana Applies AI to Franchise and Multi-Location Operations
Corvana is purpose-built for exactly this operational context. It connects to the systems franchise groups and multi-location businesses already use, unifies the data, and applies AI to surface what matters — without requiring any technical expertise from the operator.
Key integrations for multi-location operators include:
- POS: Square, Lightspeed, Kounta, Mr Yum, Tyro — capturing transaction data, product mix and throughput by site in real time
- Accounting: Xero, MYOB, QuickBooks — pulling financials so margin, cash flow and cost ratios are always current
- Rostering & payroll: Deputy, Tanda, Employment Hero — enabling labour cost benchmarking and compliance monitoring across the network
- CRM & marketing: HubSpot, Salesforce, Mailchimp, ActiveCampaign — supporting customer lifetime value tracking and churn early-warning by location
Within Corvana, franchise operators get:
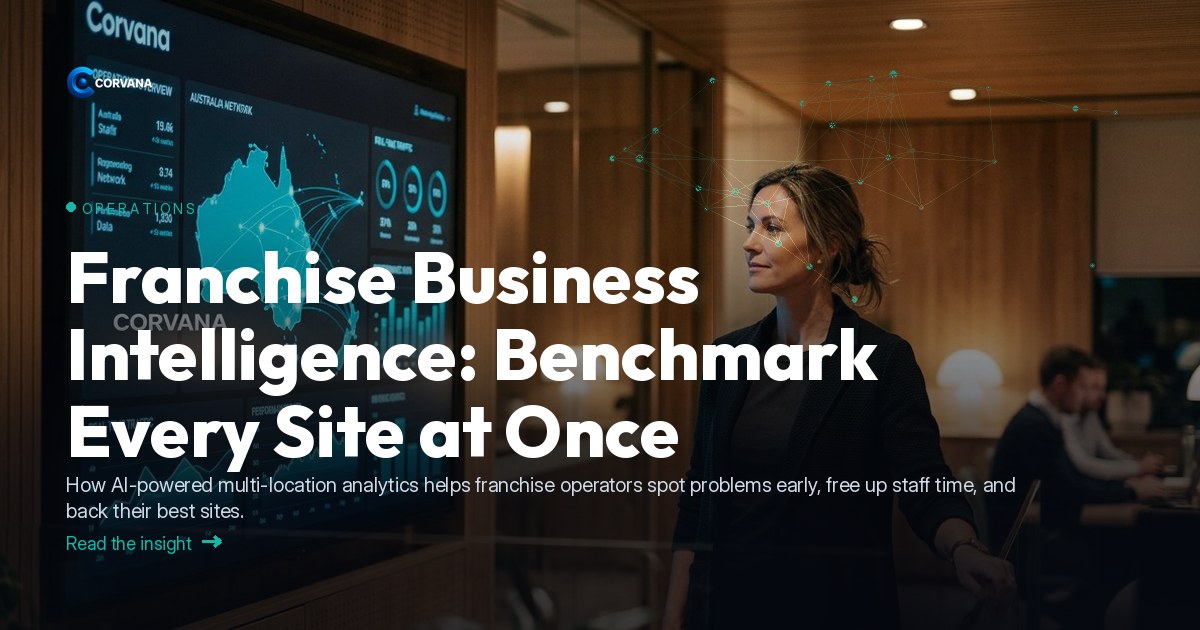
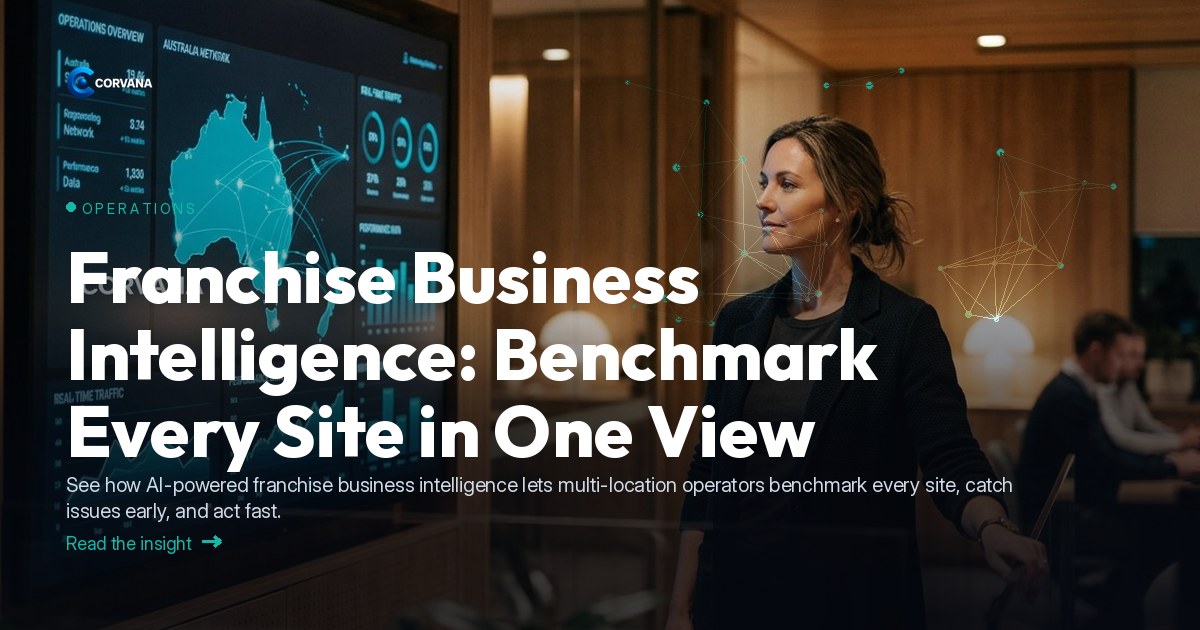
- Live unit-level dashboards showing every site's performance side by side
- Automated weekly reporting distributed to franchisors, area managers and franchisees with role-appropriate permissions — so each stakeholder sees their relevant view, not the full data set
- AI-driven forecasting for cash flow, demand and staffing needs, helping each site plan ahead rather than react
- Benchmarking against ATO/ANZSIC industry norms, giving operators an external reference point alongside their internal network comparisons
- Anomaly alerts that flag when a site drifts outside expected ranges on cost, revenue or compliance metrics
For QSR groups specifically, this means live visibility over food cost percentages, labour ratios and transaction volume at every site — updated continuously, not monthly.
[Gartner](https://www.gartner.com) research has consistently highlighted that the organisations seeing the strongest return from analytics investments are those that embed insights directly into operational workflows rather than treating data as a separate reporting exercise. Corvana is designed with that principle at its core.
---
Frequently Asked Questions
What is franchise business intelligence and how is it different from standard reporting?
Franchise business intelligence refers to platforms and processes that aggregate data across every site in a network and surface performance insights in real time. Unlike standard reporting — which typically consolidates historical data manually and on a delay — BI platforms ingest live data from POS, payroll and accounting systems simultaneously, enabling franchisors and operators to compare unit performance, detect anomalies and make decisions without waiting for end-of-period summaries.
How does unit-level benchmarking actually help a QSR franchise group?
Unit-level benchmarking lets a QSR franchisor rank every site on the metrics that matter — food cost percentage, labour ratio, average transaction value, throughput per hour — and instantly see which sites are outperforming or underperforming the network average. This makes it straightforward to prioritise where to direct coaching, identify best-practice sites worth learning from, and catch margin leaks or compliance gaps before they compound across the group.
Does a franchisee need their own data analyst to use a platform like this?
No. Platforms like Corvana are designed specifically so that operators — not data specialists — can act on the insights. Role-based dashboards mean each franchisee, area manager or franchisor sees a view tailored to their responsibilities. Automated reporting, plain-language alerts and AI-generated summaries mean the interpretation work is done by the system, leaving the operator to focus on the decision rather than the analysis.
---
If you'd like to see how Corvana brings all of this together across your network, we'd be glad to show you a live view of what your sites could look like in one dashboard.