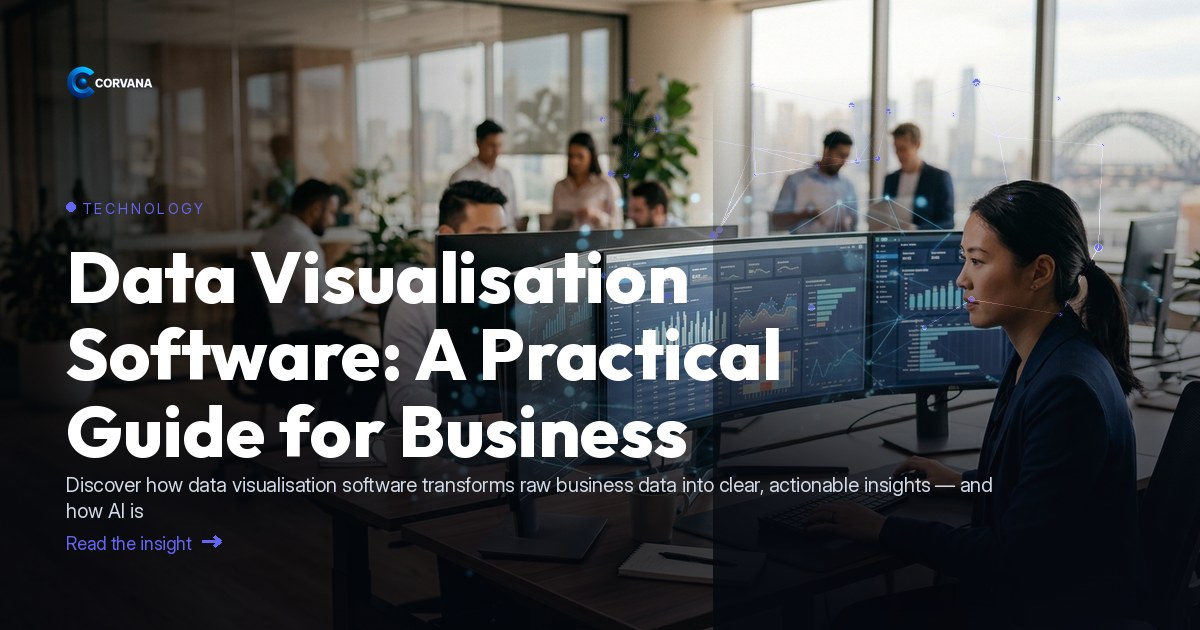
Data Visualisation Software: A Practical Guide for Business Operators
Data visualisation software has moved well beyond static charts and spreadsheet graphs — AI is now reshaping what these tools can actually do for the businesses that depend on them. Where operators once waited days for a report to tell them what had already gone wrong, today's AI-driven platforms surface patterns in real time, flag risks before they become problems, and point directly to the opportunities hiding in plain sight. For Australian business operators, understanding this shift isn't a technical exercise — it's a commercial one.
What Is Data Visualisation Software?
Data visualisation software translates raw business data — sales figures, payroll costs, customer behaviour, cash flow — into visual formats that humans can interpret quickly: dashboards, charts, heat maps and trend lines. Modern commercial platforms go further by layering AI over that visual layer, so the software doesn't just show you what happened; it tells you what it means and what to do next. For a business operator juggling multiple systems, this is the difference between drowning in numbers and making confident decisions.
Why AI Is Changing the Game for Business Operators
[Gartner](https://www.gartner.com) has consistently identified AI-augmented analytics as one of the most significant shifts in enterprise technology, and its effects are filtering through to SMEs faster than most operators realise. The core change is this: traditional visualisation tools were passive — you had to know what question to ask. AI-powered platforms are proactive — they monitor your data continuously and alert you when something warrants attention, whether that's a margin squeeze, a spike in customer churn, or a staffing cost running ahead of revenue.
For technology-sector businesses and the operators who rely on integrated digital tools, this matters enormously. Your data no longer lives in one system — it spans your accounting platform, your CRM, your payroll tool and your point-of-sale or billing system. Meaningful visualisation requires all of that unified, not siloed.
The Three Outcomes That Matter
1. Freeing Up Staff Time
Manual reporting is one of the quietest drains on a business. Someone builds a spreadsheet, pulls exports from three or four different systems, formats a summary, and sends it around — every week, every month. That work rarely surfaces anything surprising, yet it consumes hours that skilled people could spend on higher-value tasks.
AI-powered data visualisation software automates this entirely. Dashboards refresh in real time. Weekly performance summaries are generated and distributed automatically. Staff can stop compiling data and start acting on it.
2. Reducing Business Weaknesses — Catching Problems Early
The commercial value of good visualisation isn't in celebrating what went well. It's in catching what's quietly going wrong before it becomes a crisis. AI monitoring across unified data sources can surface:
- Margin erosion on specific products or services before it hits the bottom line
- Unusual increases in staff costs relative to revenue
- Early indicators of customer churn — declining engagement, lower repeat visit frequency
- Cash flow shortfalls projected weeks ahead, not days
- Compliance gaps — such as payroll discrepancies — that manual processes tend to miss
According to the [Productivity Commission](https://www.pc.gov.au), improving the quality and use of data within businesses is one of the clearest levers available for lifting productivity — and for most SMEs, the barrier isn't data availability, it's data legibility.
3. Capitalising on Strengths
The other side of early-warning intelligence is opportunity intelligence: understanding which products, customer segments, team members or locations are already performing well — and doubling down on them. Visualisation software that segments performance clearly allows operators to:
- Identify their highest-lifetime-value customers and target similar acquisition
- Pinpoint which services or product lines carry the strongest margins
- Understand which time periods, channels or staff drive the best conversion
- Benchmark performance against industry norms to understand where they genuinely lead
How Corvana Applies AI to This
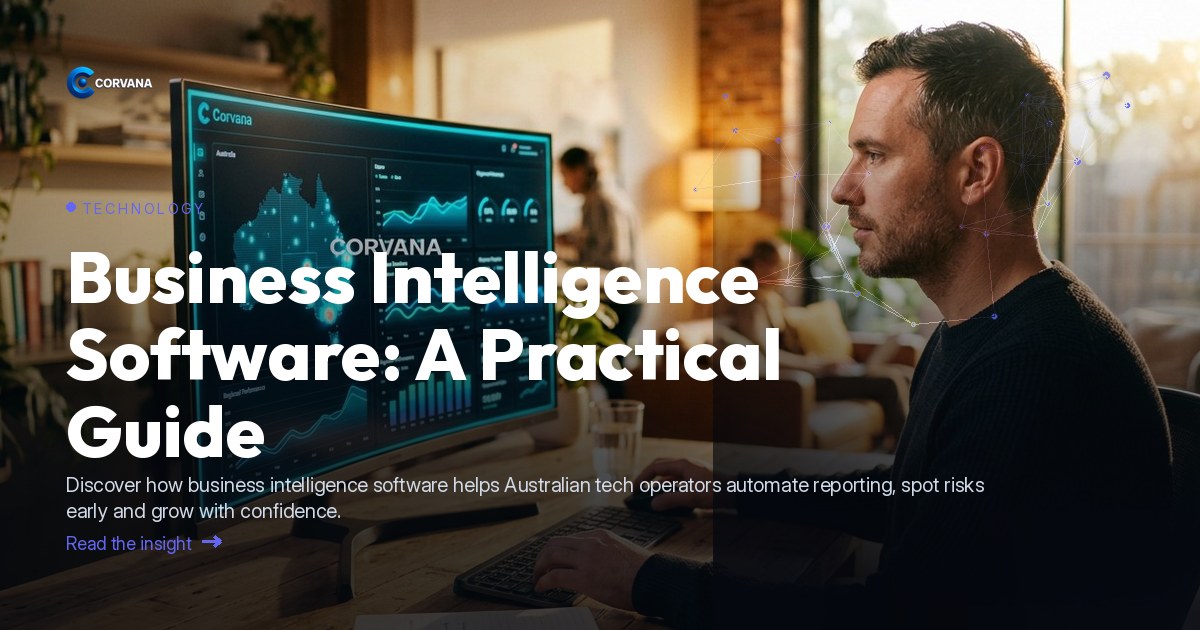
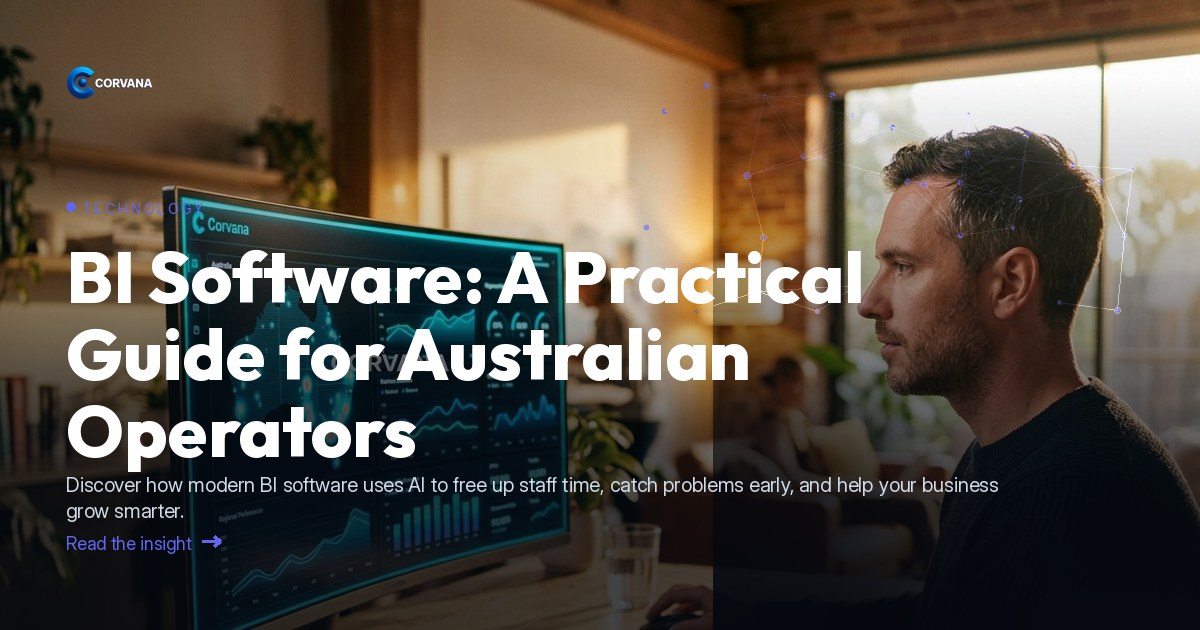
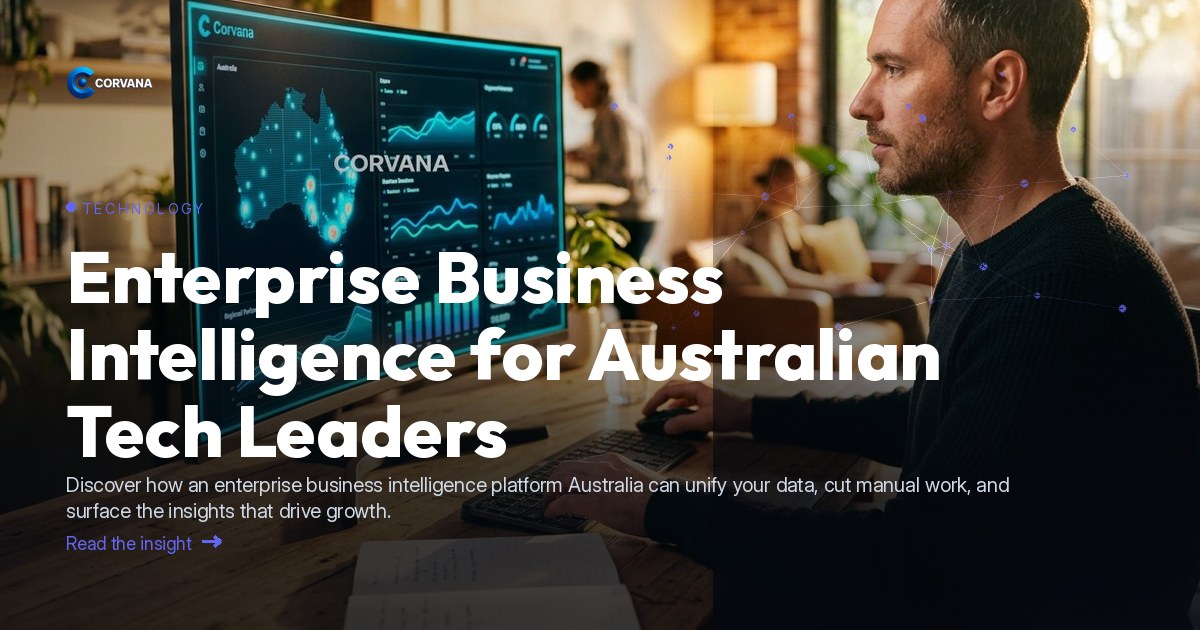
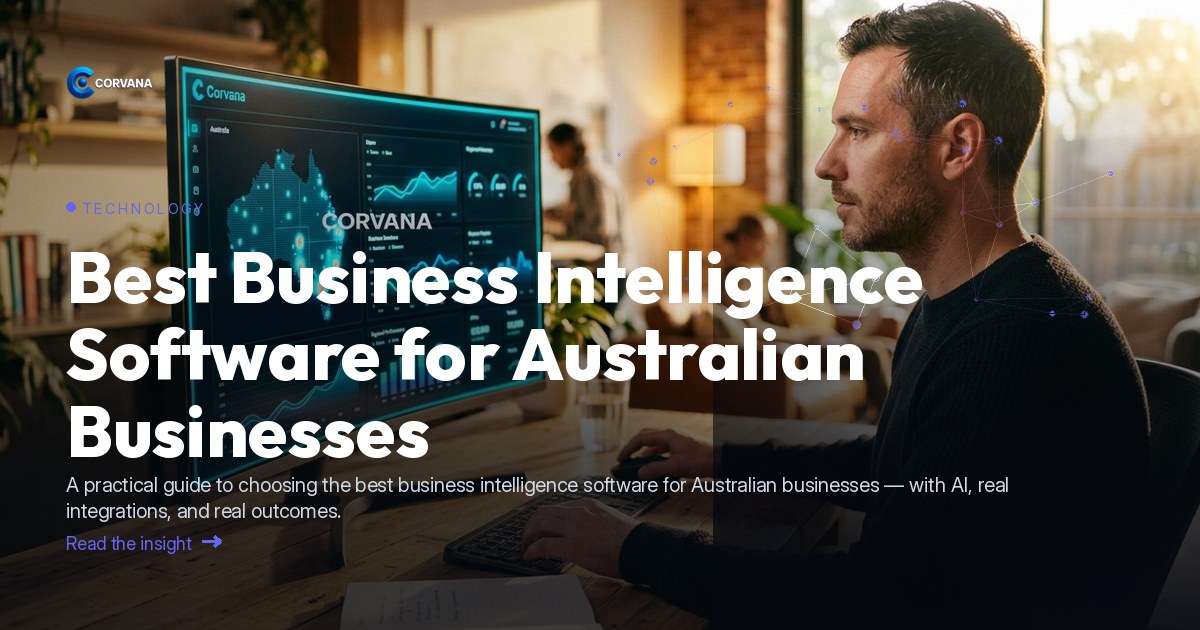
Corvana is an Australian AI business-intelligence platform built specifically for operators who need their data to make sense without needing a data team to interpret it. It unifies data from across a business's existing tools into a single real-time visual dashboard — connecting accounting platforms like Xero, MYOB and QuickBooks; CRM and marketing tools like HubSpot, Salesforce, Mailchimp and ActiveCampaign; and analytics sources including Google Analytics and Google Sheets.
Here's what that looks like in practice:
- Live dashboards bring together financial performance, customer activity, staffing costs and operational data in one view — no manual consolidation required
- AI-driven forecasting projects cash flow, demand and staffing needs forward so operators can make proactive decisions
- Automated weekly reporting means the summary your team used to spend half a day building arrives in their inbox without anyone lifting a finger
- Customer lifetime value tracking and churn early-warning surfaces which customers are drifting before they leave — and flags which segments are growing
- Benchmarking against ATO/ANZSIC industry data gives operators a calibrated view of where they stand relative to peers, not just their own historical performance
- Industry-specific roles and permissions mean the right people see the right data — without the compliance risk of open access
For businesses already using tools like Stripe for billing, Airtable or Notion for operations, or Meta Business Suite for marketing, Corvana pulls those data streams together so nothing sits in a silo.
[IDC](https://www.idc.com) research has highlighted that organisations investing in AI-driven analytics platforms see measurable improvements in decision speed and operational efficiency — and for Australian operators navigating a complex economic environment, that kind of intelligence is increasingly a commercial necessity, not a luxury. It's also worth noting that responsible data handling underpins all of this: the [Office of the Australian Information Commissioner (OAIC)](https://www.oaic.gov.au) provides clear guidance on privacy obligations for businesses managing customer and employee data, and a well-configured BI platform should support — not complicate — compliance.
Frequently Asked Questions
What's the difference between basic reporting tools and AI-powered data visualisation software?
Basic reporting tools present historical data in a fixed format — you decide what to look at and the tool displays it. AI-powered visualisation software continuously monitors your data, surfaces anomalies and opportunities you didn't think to look for, and delivers forward-looking forecasts rather than just backward-looking summaries. For busy operators, that shift from reactive to proactive insight is the core commercial difference.
Does my business need a data analyst to use data visualisation software?
Modern AI-driven platforms are designed so that operators without technical backgrounds can interpret and act on what they see. The best tools do the analytical heavy lifting — flagging what matters, contextualising performance against benchmarks, and generating plain-language summaries — so the dashboards inform decisions rather than require interpretation.
Can data visualisation software connect to the tools I already use?
Yes — most enterprise-grade and SME-focused platforms are built around integrations with common business tools. Corvana, for example, connects with accounting platforms, CRM systems, payroll tools, POS systems and marketing platforms, meaning you typically don't need to replace existing software; you simply unify the data those tools already generate.
---
See how Corvana brings all of this together in one clear, real-time view — built for Australian operators who'd rather be running their business than building spreadsheets.