Real-Time KPI Dashboard for a Multi-Site Business: A Practical Guide
AI is fundamentally changing how multi-site operators run their businesses. Where once a head-office team spent days chasing reports from individual locations, pulling together spreadsheets and second-guessing the numbers, AI-powered platforms can now surface a real-time KPI dashboard for a multi-site business in seconds — automatically, consistently, and without anyone manually compiling a thing. For operations leaders managing two sites or twenty, that shift is not incremental. It is structural.
What Is a Real-Time KPI Dashboard for a Multi-Site Business?
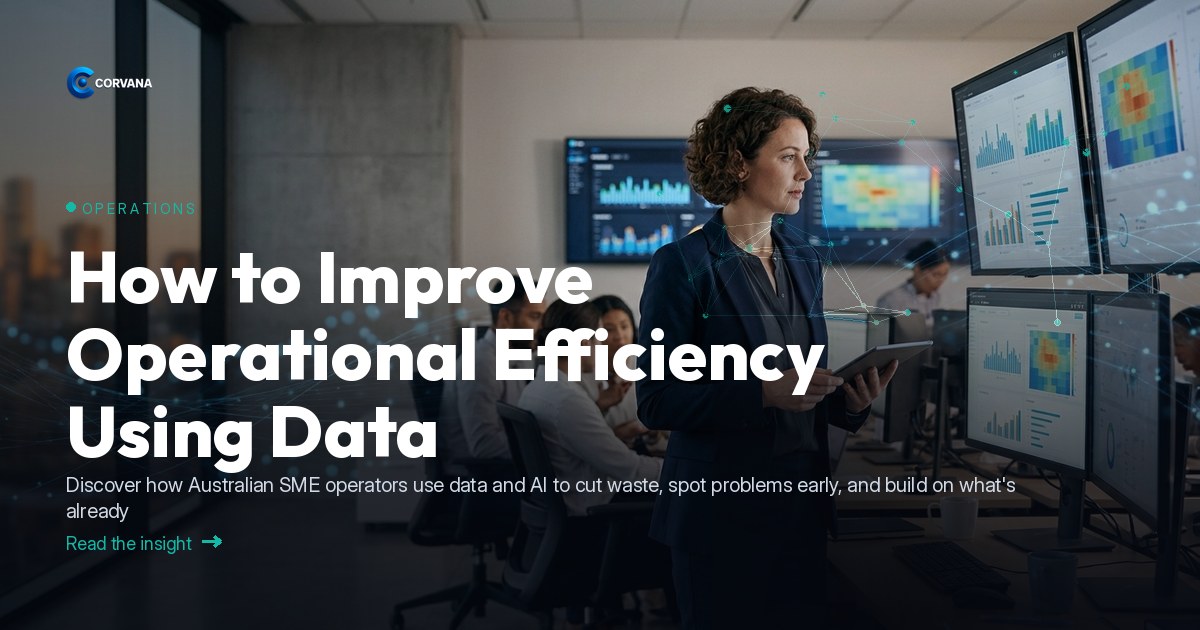
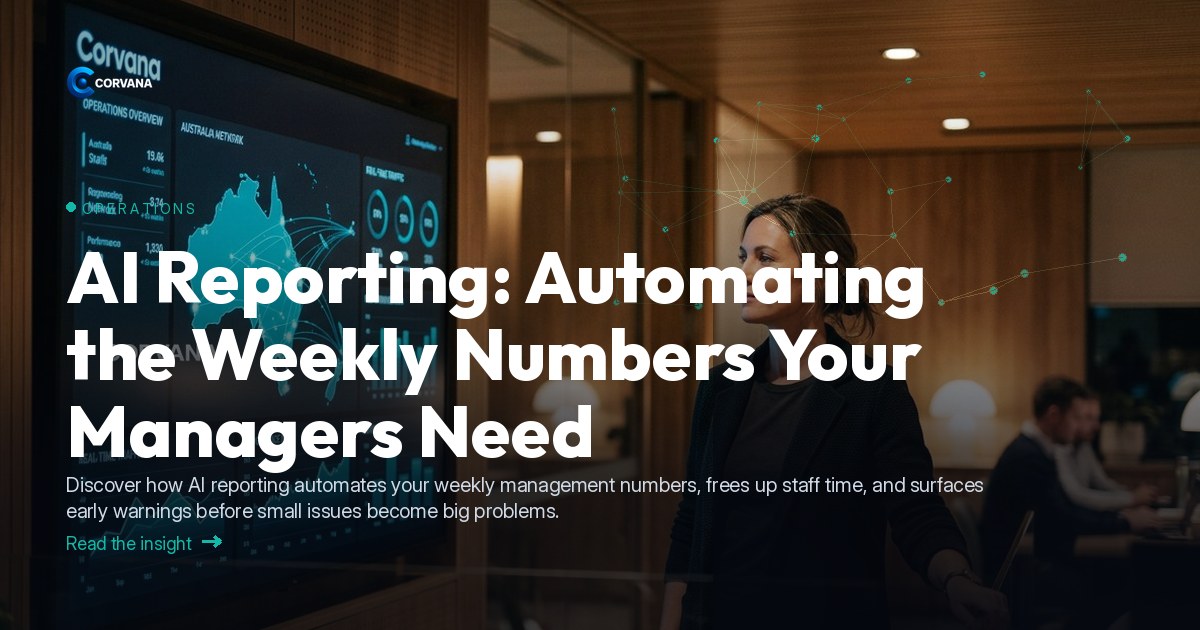
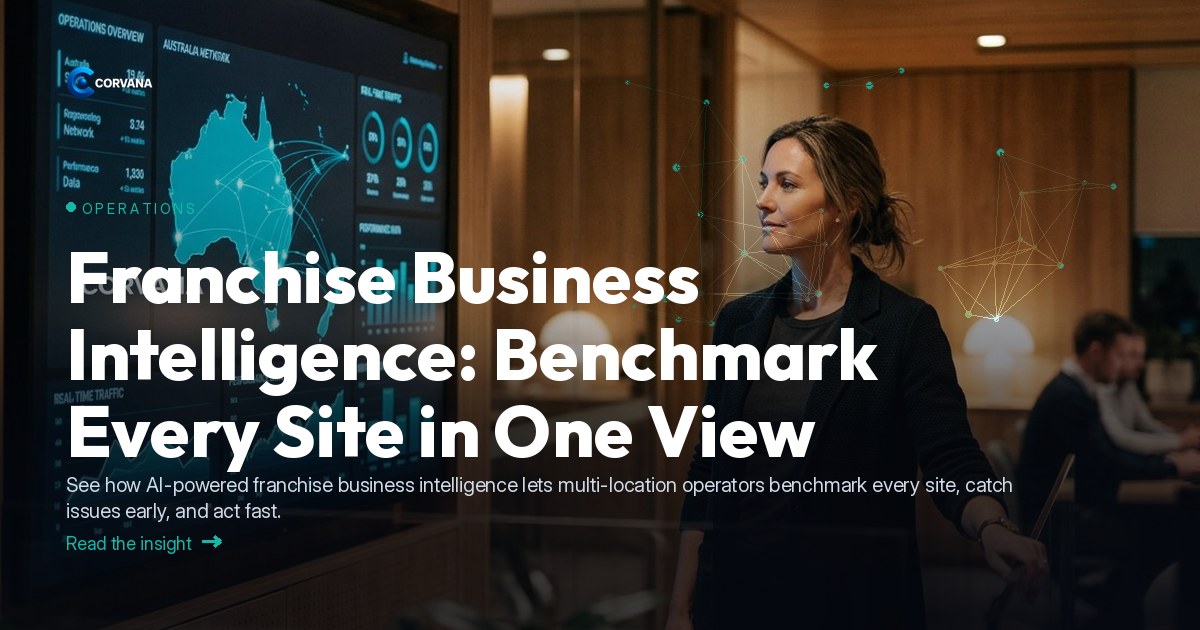
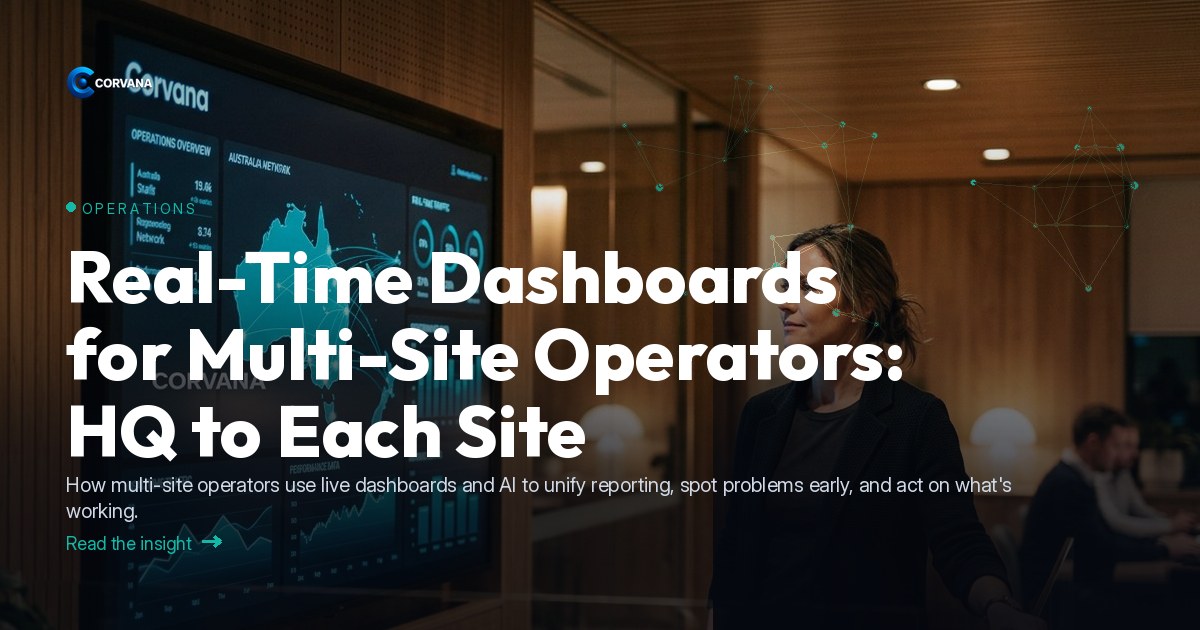
A real-time KPI dashboard for a multi-site business is a single, live view that consolidates performance data from every location — revenue, margins, labour costs, customer activity, compliance status and more — updated continuously as transactions occur. Instead of waiting for end-of-week reports or manually reconciling figures from different systems, operations managers see what is happening right now, across every site, in one place. For Australian multi-site operators, this means faster decisions, fewer blind spots, and a much clearer picture of where the business is genuinely strong.
---
Why Standard Reporting Falls Short Across Multiple Sites
Managing one location is demanding. Managing several compounds every operational risk. Data arrives late, in inconsistent formats, from different point-of-sale systems, rostering tools and accounting platforms. By the time a manager identifies a problem — an underperforming site, a margin leak, a staffing imbalance — it has often been running for weeks.
[Research from McKinsey & Company](https://www.mckinsey.com) consistently shows that organisations which embed data into daily decision-making outperform those relying on periodic reviews. For multi-site operations, that gap widens considerably: the more locations involved, the more valuable live visibility becomes.
The result of relying on static reports is predictable: reactive management, inconsistent customer experiences across locations, and missed opportunities to replicate what is working in your best-performing sites.
---
Three Outcomes That Matter for Multi-Site Operators
1. Freeing Up Staff Time
Operations teams in multi-site businesses spend a disproportionate amount of time on reporting — pulling numbers, formatting summaries, chasing site managers for updates. Automating this process does not just save hours; it redirects skilled people toward decisions only humans can make.
A well-configured real-time KPI dashboard eliminates manual consolidation entirely. Automated weekly reports go out to the right people without anyone generating them. Alerts fire when a metric crosses a threshold. Staff time shifts from administration to action.
2. Catching Problems Early — Before They Compound
The most damaging operational issues rarely appear suddenly. Margin compression, rising staff turnover, drifting compliance, early customer churn — these develop gradually and are only visible if you are watching the right indicators in real time.
For multi-site businesses, early-warning capability is especially valuable because a problem at one location can quietly spread its impact to the whole portfolio. The [Productivity Commission](https://www.pc.gov.au) has noted the relationship between operational efficiency and business resilience — and few things undermine resilience faster than problems discovered late.
A real-time KPI dashboard surfaces these signals automatically:
- Labour cost creeping above budget at a specific site
- A location's average transaction value declining week-on-week
- Customer return rates dropping ahead of measurable revenue impact
- Compliance gaps flagged before they become a liability
3. Backing Your Strengths
Just as important as identifying problems is identifying what is working — and understanding why. Which location has the strongest customer lifetime value? Which product category is driving margin, not just revenue? Which staff roster configuration correlates with the highest customer satisfaction scores?
Multi-site operators who answer these questions consistently can replicate winning patterns across their portfolio. A real-time dashboard does not just report the past; with AI-driven forecasting, it shows where momentum is building and where to invest next.
---
How Corvana Applies AI to Multi-Site Operations
Corvana is built specifically for Australian operators running multiple locations who need a single source of truth without a data analyst on staff.
The platform connects directly to the tools your sites already use:
- POS systems including Square, Lightspeed, Kounta, and Shopify — so sales data flows in automatically from every register
- Accounting platforms including Xero, MYOB, and QuickBooks — giving a live view of margins, cash flow and cost variance across the portfolio
- Rostering and payroll tools including Deputy, Tanda, and Employment Hero — so labour costs and schedule efficiency are always visible alongside revenue
- CRM and marketing platforms including HubSpot, Salesforce, Mailchimp, and ActiveCampaign — connecting customer behaviour to operational performance
Once connected, Corvana's AI does the heavy lifting. It unifies all data streams into a single real-time KPI dashboard, runs AI-driven forecasting for cash flow, demand and staffing, and benchmarks each location's performance against ATO and ANZSIC industry data — so you always know how your sites compare to sector norms, not just to each other.
Automated weekly reports go to the right people (with role-based permissions, so a site manager sees their location, while the operations director sees everything). Customer lifetime value and churn early-warning run continuously in the background. Compliance monitoring flags issues before they escalate.
For operations leaders, the practical effect is a step-change: less time in spreadsheets, more time acting on intelligence that is current, accurate and already interpreted.
---
Frequently Asked Questions
How quickly can a multi-site business get a real-time KPI dashboard up and running?
With a platform like Corvana that connects to existing POS, accounting and rostering tools, most multi-site operators are seeing live data within days rather than months — there is no need to rebuild your tech stack or hire a data team. The key is choosing a platform with pre-built integrations for the tools your sites already use, so setup is configuration rather than custom development.
What KPIs should a multi-site operations dashboard actually track?
The most useful KPIs for multi-site operations combine financial metrics (revenue per site, gross margin, labour cost as a percentage of sales), customer metrics (average transaction value, return rate, lifetime value), and operational metrics (roster efficiency, compliance status, cash flow forecast). The goal is a dashboard that tells you not just what happened, but where action is needed today.
How does AI improve on a standard reporting dashboard?
A standard dashboard shows historical data; an AI-powered dashboard interprets it, forecasts forward, and surfaces the signals that matter — without you having to know what to look for. AI can flag a margin trend at one location before it appears in a monthly P&L, predict a staffing shortfall based on upcoming demand patterns, and identify which customer segments are drifting before revenue is affected.
---
If you would like to see how Corvana brings all of this together for your specific locations and systems, it is worth taking a closer look at what the platform does in practice.